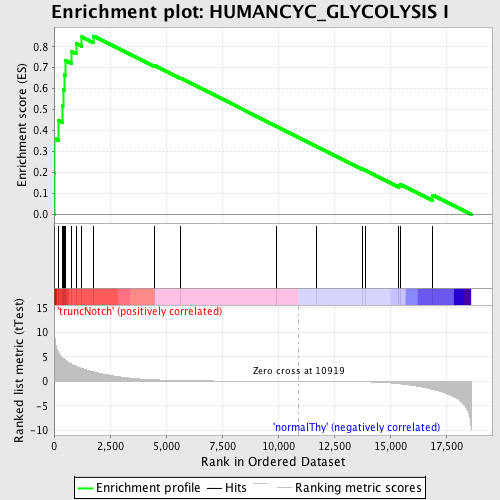
Profile of the Running ES Score & Positions of GeneSet Members on the Rank Ordered List
| Dataset | Set_03_truncNotch_versus_normalThy.phenotype_truncNotch_versus_normalThy.cls #truncNotch_versus_normalThy.phenotype_truncNotch_versus_normalThy.cls #truncNotch_versus_normalThy_repos |
| Phenotype | phenotype_truncNotch_versus_normalThy.cls#truncNotch_versus_normalThy_repos |
| Upregulated in class | truncNotch |
| GeneSet | HUMANCYC_GLYCOLYSIS I |
| Enrichment Score (ES) | 0.850624 |
| Normalized Enrichment Score (NES) | 1.6998614 |
| Nominal p-value | 0.0 |
| FDR q-value | 0.028596813 |
| FWER p-Value | 0.12 |
| PROBE | DESCRIPTION (from dataset) | GENE SYMBOL | GENE_TITLE | RANK IN GENE LIST | RANK METRIC SCORE | RUNNING ES | CORE ENRICHMENT | |
|---|---|---|---|---|---|---|---|---|
| 1 | PKM2 | 6520403 70500 | 8 | 11.751 | 0.1932 | Yes | ||
| 2 | ALDOA | 6290672 | 14 | 10.281 | 0.3623 | Yes | ||
| 3 | PFKL | 6200167 | 205 | 5.841 | 0.4484 | Yes | ||
| 4 | PFKM | 1990156 5720168 | 383 | 4.761 | 0.5173 | Yes | ||
| 5 | TPI1 | 1500215 2100154 | 397 | 4.690 | 0.5939 | Yes | ||
| 6 | ENO3 | 5270136 | 448 | 4.550 | 0.6662 | Yes | ||
| 7 | FBP1 | 1470762 | 517 | 4.307 | 0.7335 | Yes | ||
| 8 | PGAM1 | 2570133 | 776 | 3.540 | 0.7779 | Yes | ||
| 9 | ENO1 | 5340128 | 1000 | 3.040 | 0.8160 | Yes | ||
| 10 | PGAM2 | 3610605 | 1240 | 2.639 | 0.8467 | Yes | ||
| 11 | PGK1 | 1570494 630300 | 1768 | 1.961 | 0.8506 | Yes | ||
| 12 | GAPDHS | 2690463 | 4482 | 0.320 | 0.7100 | No | ||
| 13 | FBP2 | 1580193 | 5642 | 0.169 | 0.6505 | No | ||
| 14 | PKLR | 1170400 2470114 | 9931 | 0.016 | 0.4202 | No | ||
| 15 | ALDOB | 4730324 | 11701 | -0.014 | 0.3253 | No | ||
| 16 | PGK2 | 2650091 | 13746 | -0.087 | 0.2168 | No | ||
| 17 | ALDOC | 450121 610427 | 13912 | -0.100 | 0.2096 | No | ||
| 18 | PFKP | 70138 6760040 1170278 | 15394 | -0.474 | 0.1377 | No | ||
| 19 | BPGM | 5080520 | 15449 | -0.501 | 0.1431 | No | ||
| 20 | ENO2 | 2320068 | 16910 | -1.647 | 0.0917 | No |

